

Monitor your agent with Langfuse
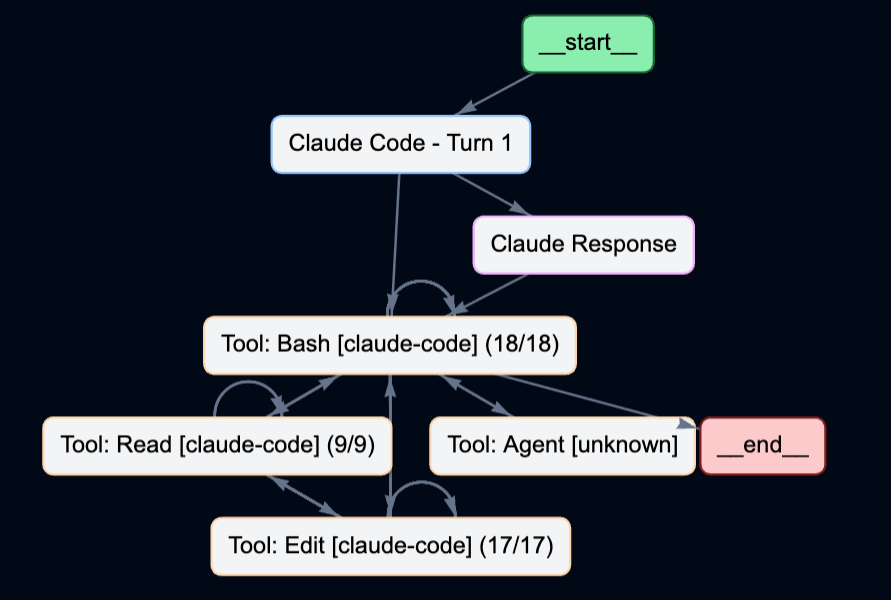
A modern coding-agent setup quickly accumulates dozens of skills, subagents, and MCP servers. The demos look impressive; the runtime behaviour is opaque. After a week of real use, three questions are hard to answer from the terminal alone: which of these are actually being invoked, in what sequence, and at what cost per task?
We call this gap trajectory observability — the ability to reconstruct an agent’s decision path turn-by-turn, attribute cost to specific tools and skills, and spot failure modes (retry loops, redundant tool calls, plan thrashing) that aggregate token counters miss. It extends classic single-call LLM observability, which optimises one prompt/response at a time, toward multi-turn behaviour you can audit and improve.
Adjacent products include hosted analytics (e.g. Helicone, LangSmith), OpenTelemetry-first stacks (Arize Phoenix, OpenLIT, vendor OTel exporters), and general APM with GenAI plugins. Langfuse fits when you want an open, LLM-first trace UI, sessions, and cost views with a self-hosted option—this walkthrough uses Docker Compose and Claude Code hooks.
By the end you should have per-turn traces, tool-level structure, and a basis for engineering decisions: which skills to keep, which to retire, and where to tighten prompts or replace tools with deterministic code.
What you will need
- Docker and Docker Compose (see Langfuse’s compose guide)
- Python 3 and
pipfor the Langfuse SDK used by the hook - Claude Code installed and able to edit
~/.claude/settings.json - Comfort sending prompt and tool payloads to a service you control (see Data and governance below)
This walkthrough covers self-hosted Langfuse, Claude Code wired through hooks, and SDK-based agents when you own the process boundary.
In production, prefer a dedicated Langfuse deployment with backups, retention policy, access control, and support—rather than a laptop-only compose stack.
For engineering managers and architects
Before you standardize trajectory observability across teams or delivery units, treat it like any other data platform: align on classification (what prompts and tool I/O may leave an engineer’s machine), ownership of the Langfuse deployment and API keys, retention and deletion, and whether client or regulated codebases are in or out of scope. Pilot on internal repositories first; gate wider rollout with a short checklist—for example redaction reviewed in the hook, base URL and project pinned per environment, and security sign-off where traces could contain secrets or PII. For leadership, the payoff is operational evidence—unused skills, runaway sessions, cost per feature or incident—not dashboards alone.
1. Run Langfuse locally (Docker Compose)
Follow the official compose guide: Docker Compose deployment (self-hosted). In short:
git clone https://github.com/langfuse/langfuse.git
cd langfuse
docker compose up
Wait until the stack is healthy instead of guessing by time alone: in the logs, the langfuse-web container should report Ready, or run docker compose ps and confirm services are running (not restarting). Then open the UI at http://localhost:3000 (default in the upstream compose layout).
In Langfuse, create a project, then copy API keys from project settings. You will map them to LANGFUSE_PUBLIC_KEY and LANGFUSE_SECRET_KEY in the next section.
2. Point Claude Code at Langfuse
Environment variables
Edit your global Claude Code config, typically ~/.claude/settings.json, and add an env block (merge with existing keys; do not paste real secrets into dotfiles you sync or share):
{
  "env": {
    "TRACE_TO_LANGFUSE": "true",
    "CC_LANGFUSE_DEBUG": "true",
    "LANGFUSE_BASE_URL": "http://localhost:3000",
    "LANGFUSE_PUBLIC_KEY": "pk-lf-…",
    "LANGFUSE_SECRET_KEY": "sk-lf-…"
  }
}| Variable | Role |
|---|---|
TRACE_TO_LANGFUSE | Must be "true" or the hook exits immediately (safe default). |
LANGFUSE_PUBLIC_KEY / LANGFUSE_SECRET_KEY | Project credentials from Langfuse. |
LANGFUSE_BASE_URL | Self-hosted: http://localhost:3000. Cloud regions use the hostnames listed in Langfuse’s Claude Code integration (EU, US, JP, HIPAA). |
CC_LANGFUSE_DEBUG | When "true", writes verbose lines to the hook log under ~/.claude/state/. |
Note: You can scope tracing and keys per repository with
.claude/settings.local.jsonin the project root, instead of—or in addition to—machine-wide~/.claude/settings.json.
The official integration documents that pattern if you prefer not to store API keys globally.
Python dependency
The hook is a small Python entrypoint that uses the Langfuse SDK:
pip show langfuse
pip install langfuse
3. Hook script and registration
Install the hook script
Create the hooks directory:
mkdir -p ~/.claude/hooksThe hook is a single Python script invoked by Claude Code on each configured event (typically Stop). Its job is narrow:
- Read the hook payload from stdin (session id, transcript path, and related fields).
- Open the session transcript (JSONL) at the byte offset it last processed.
- Parse new lines, map them to Langfuse primitives (trace, generation, tool spans), and flush to the API.
The reference implementation is Langfuse’s Claude Code integration, Step 3 — copy that langfuse_hook.py verbatim for a reliable first pass.
Extension points worth deciding before you fork the script:
- Tool payload size. The default mapping truncates large inputs/outputs to keep batches small. If one MCP carries the signal you care about, raise limits for that tool explicitly rather than globally.
- Redaction. The hook runs in your user context with full transcript access. For client or regulated data, add a redaction pass before calling the SDK (secrets in command output, file paths, PII in prompts)—do not rely on downstream scrubbing alone.
An extended variant with extra comments and occasional tweaks lives in awrobel-gd/claude-resources (langfuse_hook.py). Treat it as a fork reference, not a supported drop-in; diff it against Langfuse’s upstream when you upgrade.
Make the script you install executable:
chmod +x ~/.claude/hooks/langfuse_hook.pyRegister the hook in settings.json
Langfuse’s documentation registers a Stop hook so each assistant response triggers an export after the transcript updates. Add under hooks in ~/.claude/settings.json:
{
  "hooks": {
    "Stop": [
      {
        "hooks": [
          {
            "type": "command",
            "command": "python3 ~/.claude/hooks/langfuse_hook.py"
          }
        ]
      }
    ]
  }
}
See Claude Code hooks.
How data moves (Claude Code → Langfuse UI)
Exact storage depends on your Langfuse version and compose profile; the UI always reads back through the Langfuse app layer.
4. Verify in Claude Code
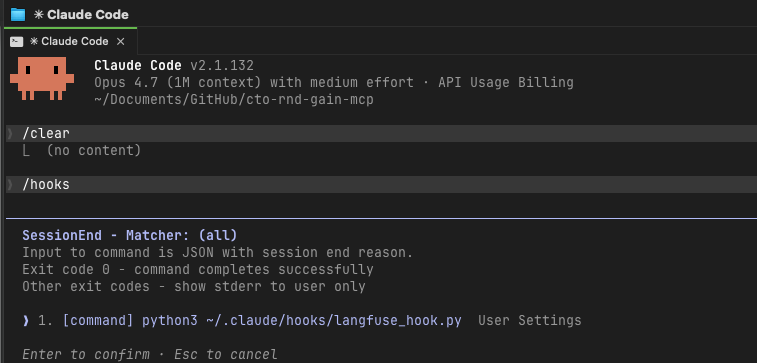
Start Claude Code from a project you care about. In the UI, open the hooks view (commonly /hooks) and confirm your Langfuse hook is listed and associated with the events you configured.
Send a short prompt that exercises a tool or MCP, then move to the troubleshooting section if nothing appears in Langfuse within a minute.
5. What you should see in Langfuse
Treat the UI as answering three engineering questions; read them in this order.
Sessions — “Where is the agent getting stuck?”
Group by session and sort by turn count. Sessions with unusually many turns often indicate retry loops, misread tool results, or oscillation between plan and execution. Those are the highest-leverage debugging targets.
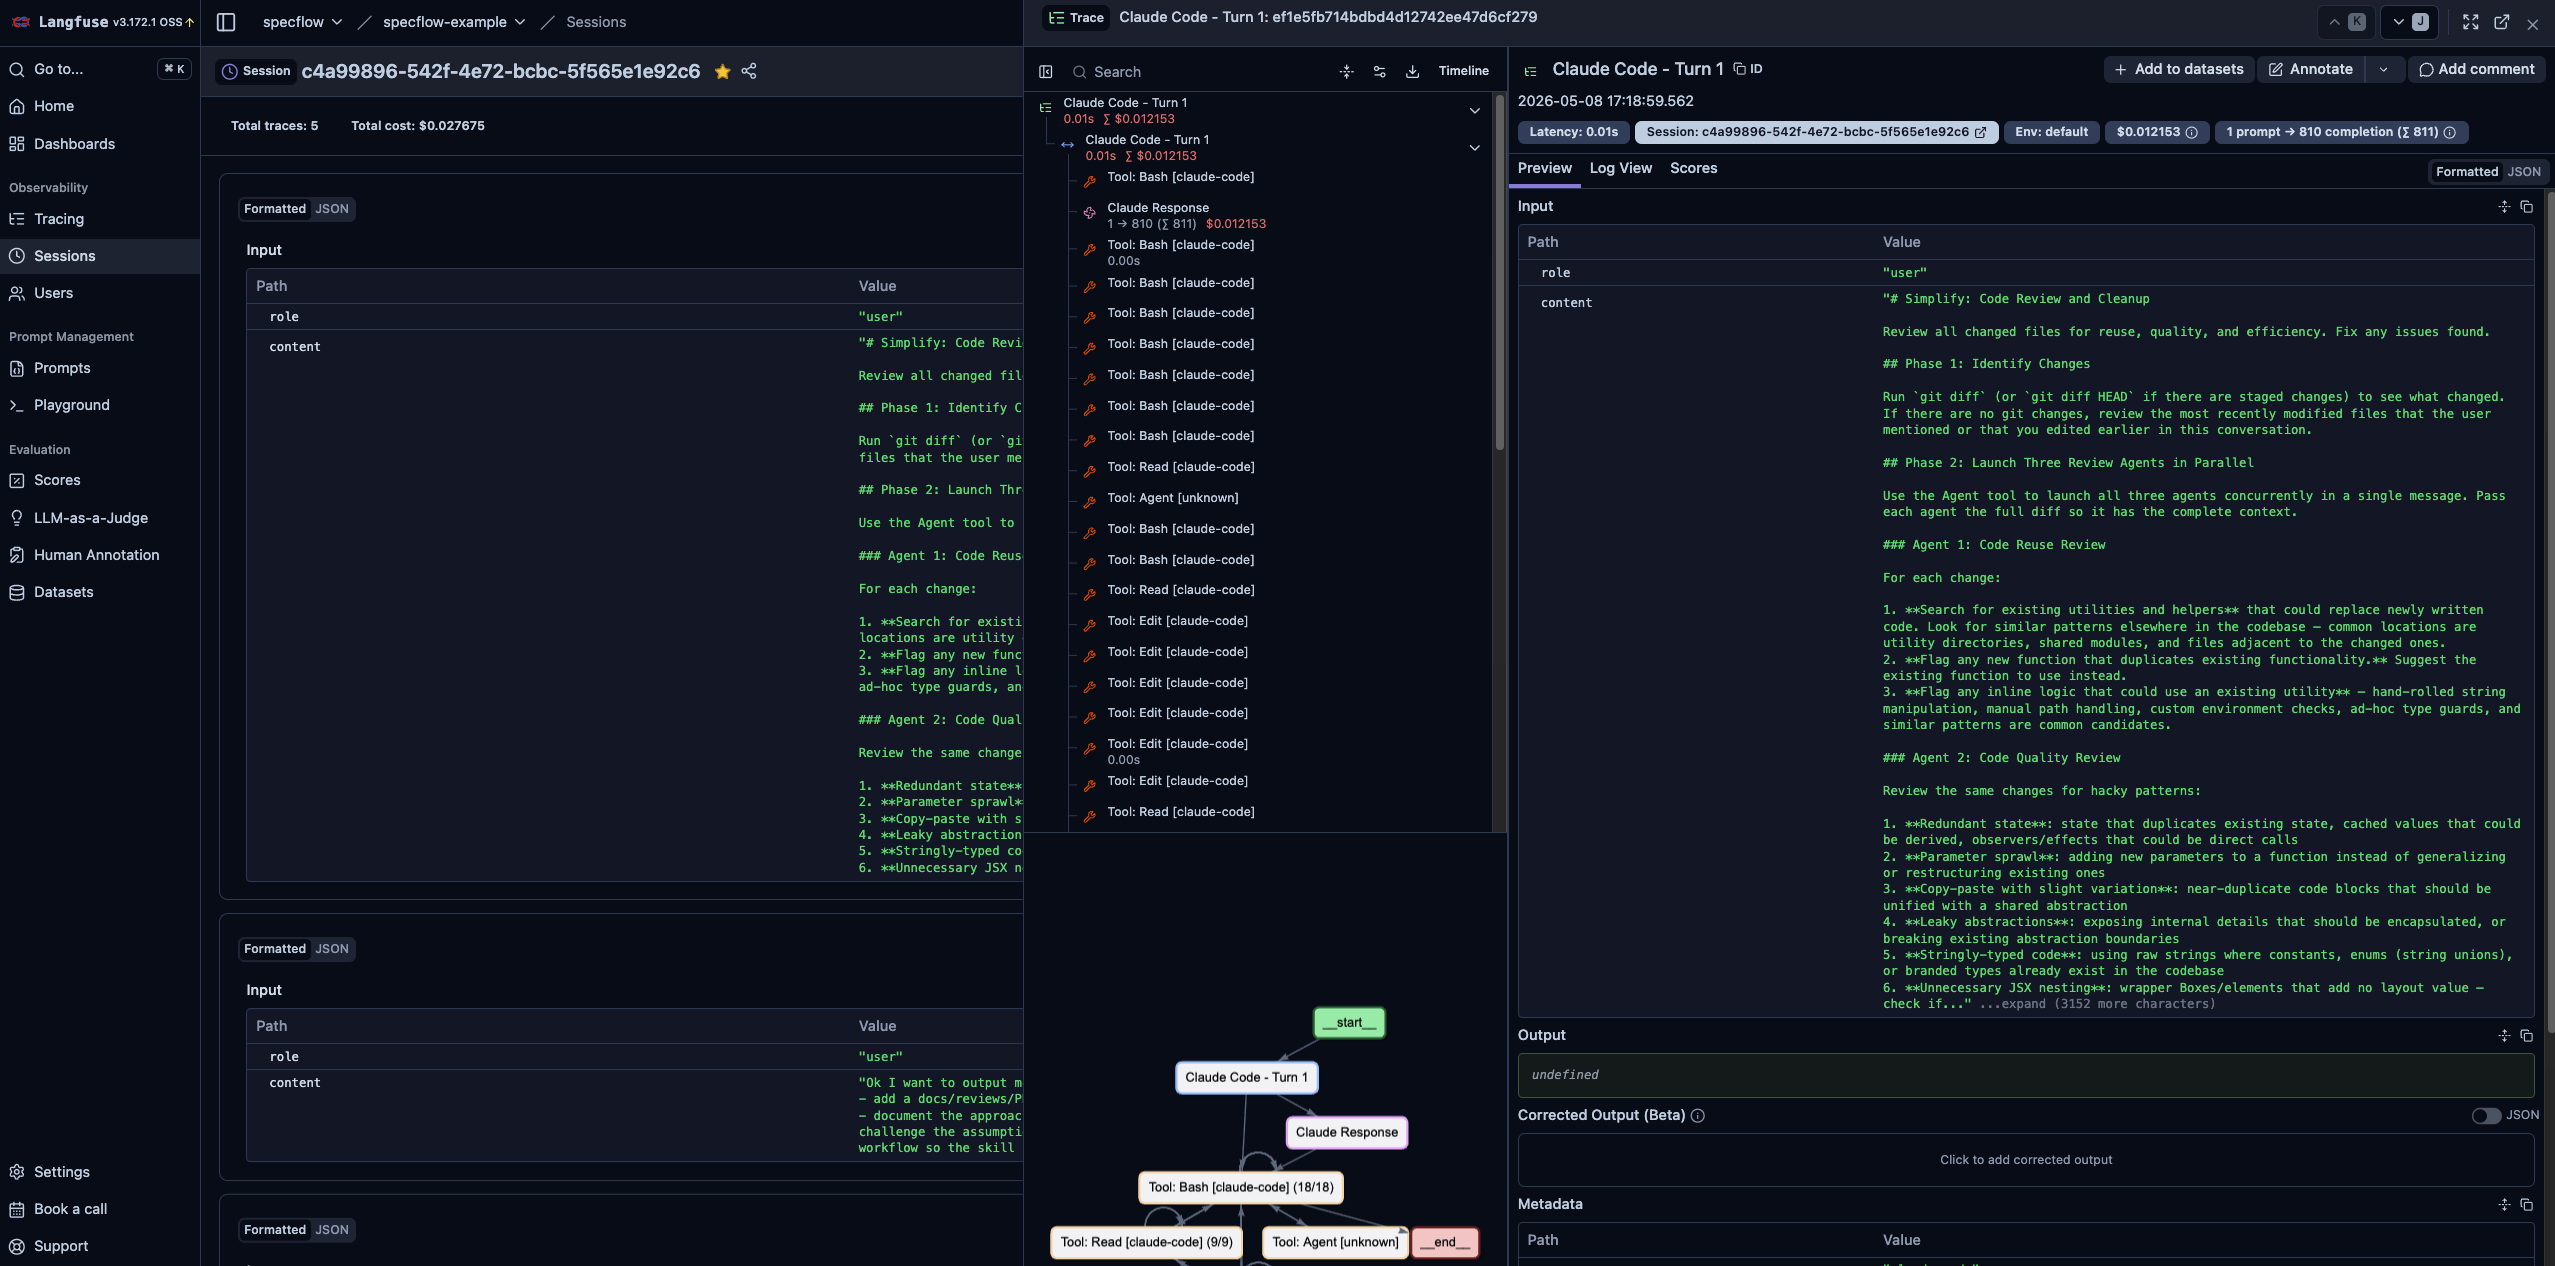
Trace detail — “What did the agent actually do?”
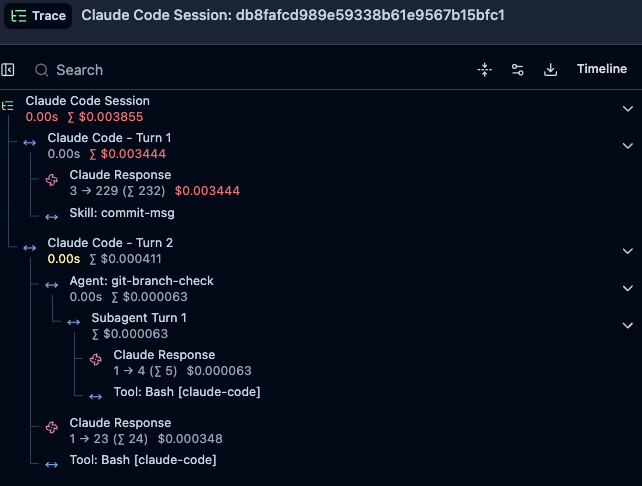
Each trace shows the sequence: prompt → model output → tool spans → results → next turn. Watch for repeated calls to the same tool with nearly identical inputs (cache or prompt issue, or ignored prior result), and long gaps between tool spans (model thrashing between planning and acting).
Aggregates (cost, latency, tool frequency) — “Which skills earn their keep?”
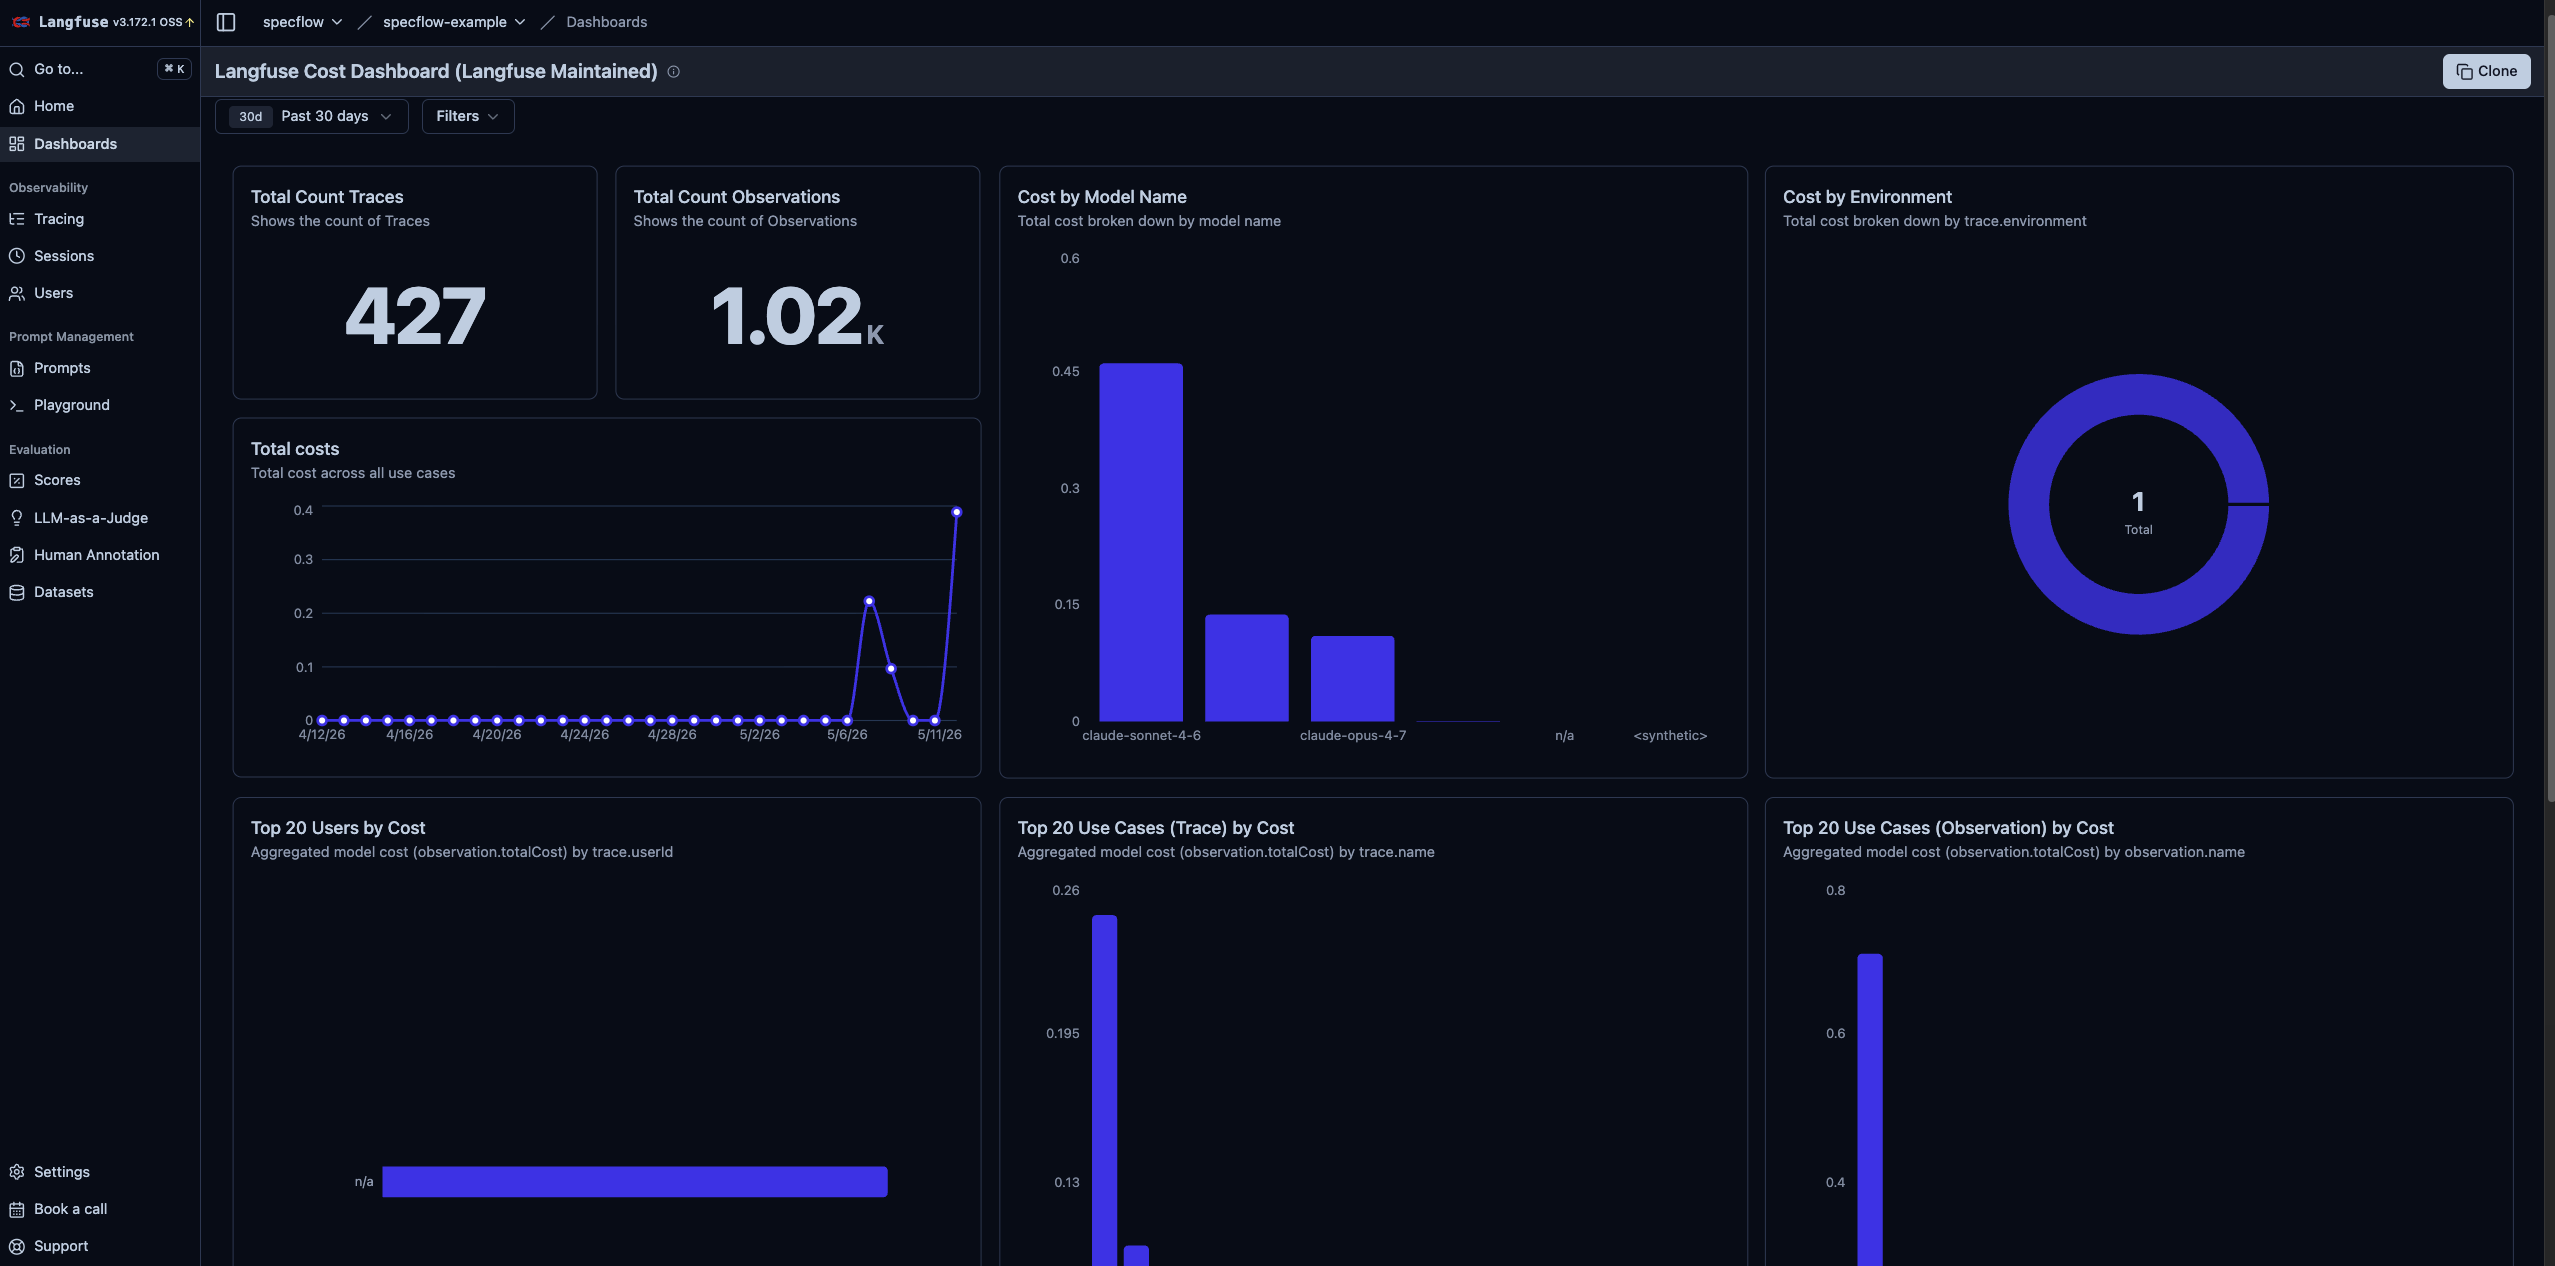
When token or cost breakdowns are available, sort by tool or span. Tools that never appear are candidates to remove from the allowlist; tools that dominate cost without matching outcomes deserve prompt tightening, a cheaper model, or a non-LLM implementation.
Example from a local self-hosted instance after a Claude Code session:
Data and governance
Tracing sends prompts, completions, and tool inputs/outputs to Langfuse. Before enabling this on client or regulated codebases:
- Use projects and keys scoped to non-production data until you have redaction and retention policies tested.
- Prefer self-hosting or an enterprise deployment where data residency and access reviews are explicit.
- Implement redaction in the hook for secrets, tokens, and identifiers; assume anything reaching the trace store could appear in exports and backups.
This is the same class of decision as logging raw HTTP bodies in a traditional service: useful for debugging, dangerous if copied blindly to shared environments.
6. Troubleshooting
| Symptom | What to try |
|---|---|
| No traces | Confirm TRACE_TO_LANGFUSE is exactly "true", keys match the project, and LANGFUSE_BASE_URL reaches your instance (curl or browser). |
| Hook seems dead | tail -f ~/.claude/state/langfuse_hook.log with CC_LANGFUSE_DEBUG=true. |
Stop never runs | Add SessionEnd as above, or confirm hook names against your Claude Code version in the hooks guide. |
| Thin traces | The stock script maps Claude Code’s JSONL transcript; custom tools or MCPs may need extra parsing or metadata in langfuse_hook.py. |
| Auth errors | For cloud, use the region-specific base URL from the integration doc; for Docker, ensure the web service port matches LANGFUSE_BASE_URL. |
Langfuse also suggests a manual dry run of the hook with env vars exported in the shell; that isolates Python/SDK issues from Claude Code’s hook runner.
7. Beyond Claude Code: SDK agents
Hooks integrate the terminal product where you do not control the main loop. When you productionize an agent—HTTP service, worker, CI eval harness—you usually own the process boundary: that is where OpenTelemetry and explicit spans shine.
The Claude Agent SDK can be instrumented with OpenInference’s openinference-instrumentation-claude-agent-sdk so spans land in Langfuse; see Observability for Claude Agent SDK with Langfuse. The same Langfuse project can hold hook-based Claude Code traces and SDK-exported traces; use tags or metadata to separate environments. OTel-based paths also align with emerging GenAI semantic conventions, so traces remain portable if you add a second backend later.
Where this is heading: evaluations are increasingly tied to traces—the same trace_id links an online session to offline judges, golden tasks, or regression suites, so “did we regress?” is answered against concrete trajectories, not only headline metrics. OpenTelemetry GenAI semantic conventions are converging on shared span shapes and attributes for prompts, completions, and tools; instrumenting with that direction in mind reduces churn when exporters and vendors align. In practice, expect agent observability to look more like service SRE—SLOs on latency and cost per completed task—with LLM-specific signals layered on top.
For a wider lens on agent stacks and tools, see Agentic frameworks overview and Learn slash command in this blog.