

Self-Service Analytics: How I Automated Daily Usage Reports in Under 3 Hours
The Challenge: Flying Blind
We built Cerebra—an internal AI platform for Grid Dynamics. Engineers were using it daily, chatting with AI agents, solving problems, experimenting with different approaches. But we had a critical blind spot: we had no idea how much it was actually being used.
How many conversations happened yesterday? Which features were people gravitating toward? Who were the power users? These weren't just vanity metrics—they were essential questions for understanding product-market fit and guiding our development priorities.
The traditional path would be familiar to anyone in a large organization: write requirements, create a ticket, assign it to someone, wait for capacity, review designs, iterate, wait some more. Best case? A few weeks. Realistic case? A few months.
I decided to take a different path: build it myself in a few hours.
The Self-Service Decision
Here's what I had going for me:
- Cerebra already stored chat history in Firestore (Google's NoSQL database)
- We had N8N deployed (an open-source workflow automation platform)
- I had an AI pair programmer (Gemini) available 24/7
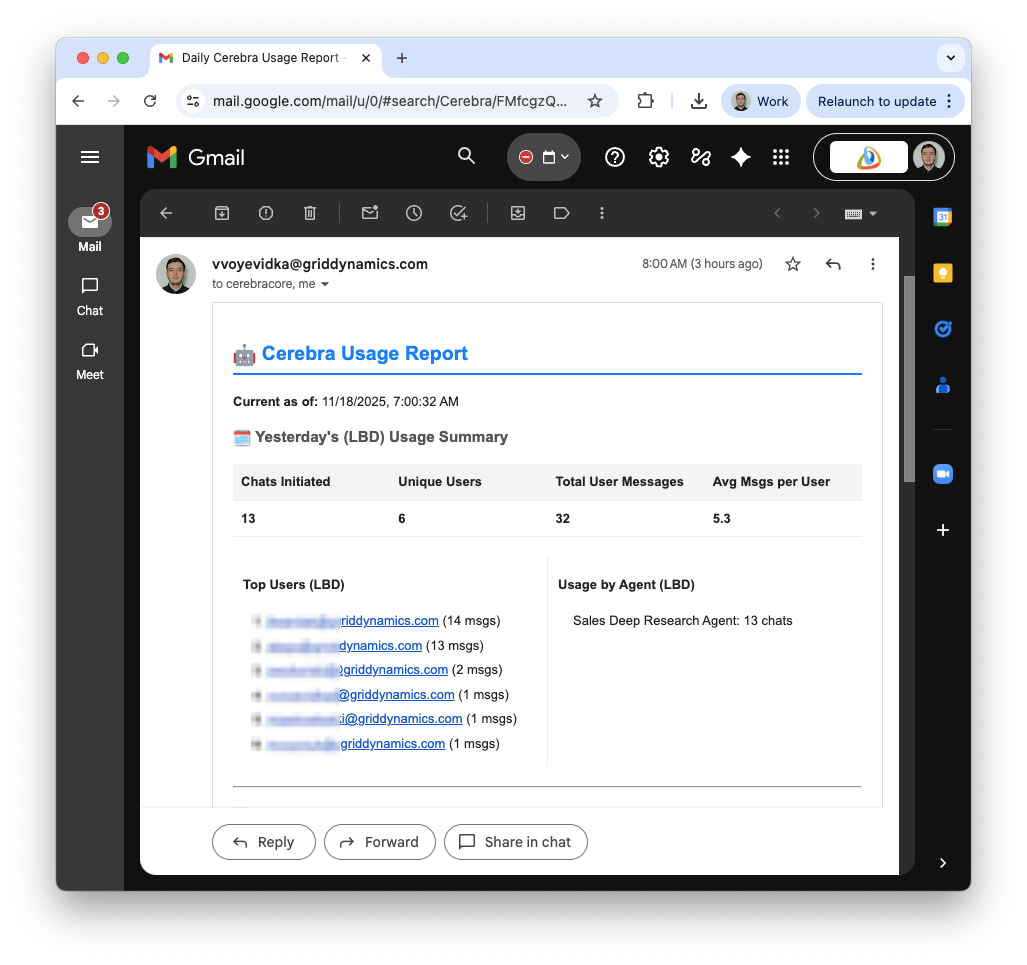
The goal was simple: wake up every morning to an email with yesterday's usage statistics. No dashboards to check, no queries to run—just actionable insights delivered automatically.
Timeline? Started at 9 PM, had the first report in my inbox by 11:30 PM. Just 2.5 hours from idea to working automation.
Building with an AI Pair Programmer
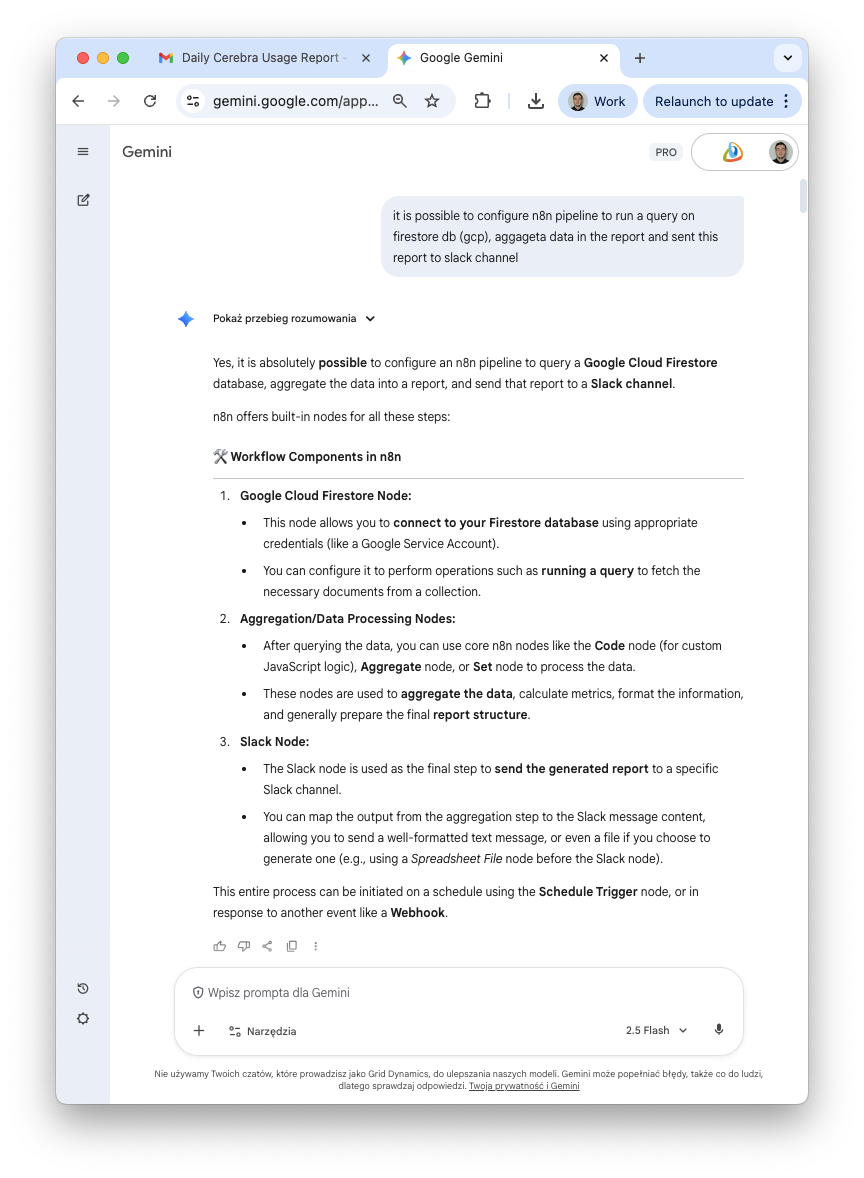
This is where the story gets interesting. I didn't start by opening N8N and figuring everything out from scratch. Instead, I opened a chat with Gemini and described what I wanted to build.
My opening prompt was straightforward:
"I have Cerebra, which stores chat history in Firestore. I want to create an N8N pipeline to calculate stats and send a daily email with usage metrics."
What followed was an iterative design session. Gemini proposed the initial architecture:
-
Three parallel Firestore queries for different time periods:
- Last Business Day (LBD) - yesterday's activity
- Current Week (CW) - week-to-date trends
- Current Month (CM) - monthly patterns
-
Data aggregation to calculate metrics per period
-
Merge the results into a single report
-
Format as HTML email and send
| Gemini Chat | Gemini Chat Continued |
|---|---|
 |  |
The Iteration Dance
The first design worked, but had issues. The real value came from iterating with Gemini:
Challenge 1: Merge Node Confusion
My first attempt used the Merge Node's "Combine" mode with "All Possible Combinations" setting. It created random combinations instead of a clean data structure.
Gemini's solution: Switch to "Append" mode, which preserves order based on connection sequence.
Challenge 2: Message Counting Logic
Initially, the code counted both user messages AND agent responses. For usage analytics, I only cared about user activity—how many questions people were asking.
My feedback to Gemini:
"I don't like the implementation of total messages. I'm not interested in how many messages came from agent, only how many user messages were submitted."
Gemini immediately refactored the counting logic to filter for msg.actor === 'User' only.
Challenge 3: Report Layout
The first email was a wall of text. I wanted better visual organization.
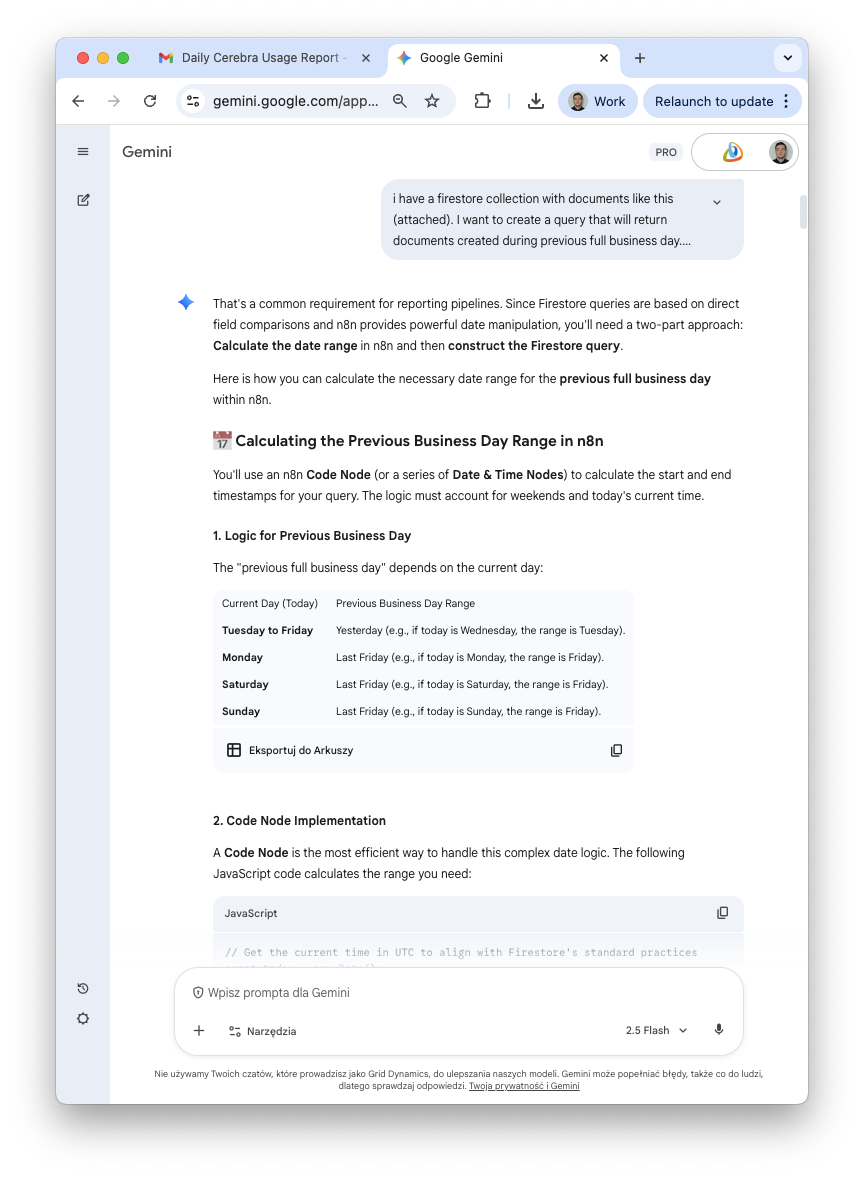
My request:
"I want for each section to have top users and usage by agent in two columns side by side."
Gemini redesigned the HTML to use a table-based two-column layout for maximum email client compatibility.
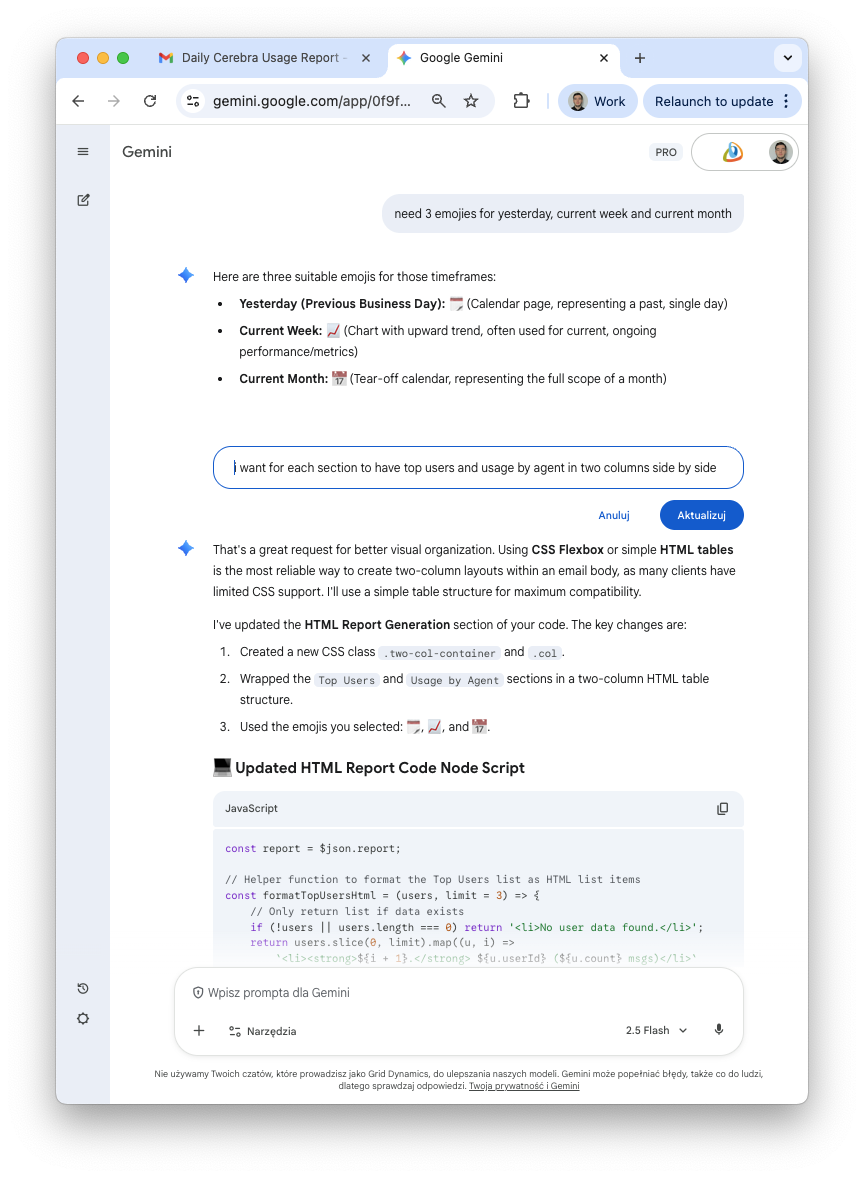
This back-and-forth took maybe 30 minutes. Each iteration made the solution better, and I never had to wait for "someone" to be available.
The Technical Implementation
Let me walk you through what actually got built. Don't worry—this isn't a full tutorial, but understanding the architecture shows how simple modern automation can be.
The N8N Pipeline
The workflow looks like this:
[Schedule Trigger - Daily 8AM]
    ↓
[Firestore: Query LBD] ──┐
[Firestore: Query CW]  ──┼─→ [Aggregate Nodes] ──→ [Merge Node]
[Firestore: Query CM]  ──┘                              ↓
                                                  [Code: Process Data]
                                                         ↓
                                                  [Code: Generate HTML]
                                                         ↓
                                                   [Send Email]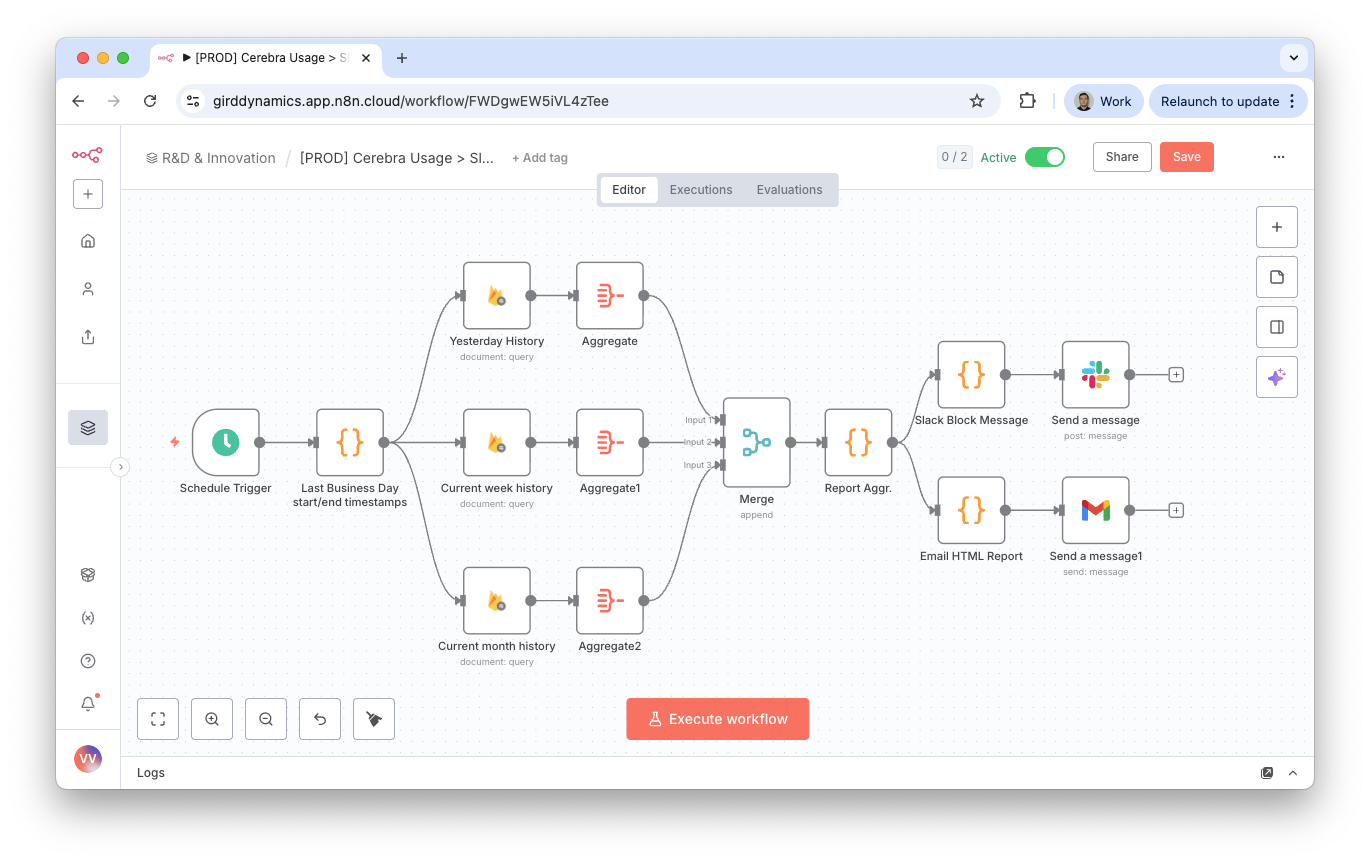
Three parallel Firestore queries pull chat sessions for each time period. Each query filters by date range using simple date math (N8N expressions make this trivial).
Aggregate nodes convert the Firestore response arrays into clean single objects with a data field.
The Merge Node combines all three into one array, preserving order.
The Core Logic: Processing Usage Data
Here's where the magic happens—a single JavaScript function that processes chat sessions and extracts meaningful metrics:
function processPeriodData(chatSessions) {
  if (!chatSessions || chatSessions.length === 0) {
    return {
      uniqueChats: 0,
      uniqueUsers: 0,
      totalMessages: 0,
      messagesPerUser: 0,
      topUsers: [],
      usageByAgent: [],
    };
  }

  const metrics = {
    uniqueChats: chatSessions.length,
    uniqueUsers: new Set(),
    totalMessages: 0,
    userMessageCounts: {},
    agentUsage: {},
  };

  for (const session of chatSessions) {
    const userId = session.userId;
    metrics.uniqueUsers.add(userId);

    // Count ONLY user messages (not agent responses)
    const userMessagesCount = session.messages ? session.messages.filter((msg) => msg.actor === "User").length : 0;

    metrics.totalMessages += userMessagesCount;
    metrics.userMessageCounts[userId] = (metrics.userMessageCounts[userId] || 0) + userMessagesCount;

    const agentName = session.agentName || "Unknown Agent";
    metrics.agentUsage[agentName] = (metrics.agentUsage[agentName] || 0) + 1;
  }

  metrics.messagesPerUser = metrics.uniqueUsers.size > 0 ? (metrics.totalMessages / metrics.uniqueUsers.size).toFixed(1) : 0;

  const topUsersArray = Object.entries(metrics.userMessageCounts)
    .map(([userId, count]) => ({ userId, count }))
    .sort((a, b) => b.count - a.count)
    .slice(0, 10);

  return {
    uniqueChats: metrics.uniqueChats,
    uniqueUsers: metrics.uniqueUsers.size,
    totalMessages: metrics.totalMessages,
    messagesPerUser: metrics.messagesPerUser,
    topUsers: topUsersArray,
    usageByAgent: Object.entries(metrics.agentUsage)
      .map(([agentName, count]) => ({ agentName, count }))
      .sort((a, b) => b.count - a.count),
  };
}
This function runs three times—once for each time period—producing a structured report object.
From Data to Email
The final step transforms the report into a clean HTML email. Using table-based layouts (for email client compatibility), the template creates a professional report with:
- Emoji section headers (🗓️ Yesterday, 📈 This Week, 📅 This Month)
- Metric tables showing key numbers at a glance
- Two-column layouts for Top Users and Agent Usage
- Sorted lists so the most important data stands out
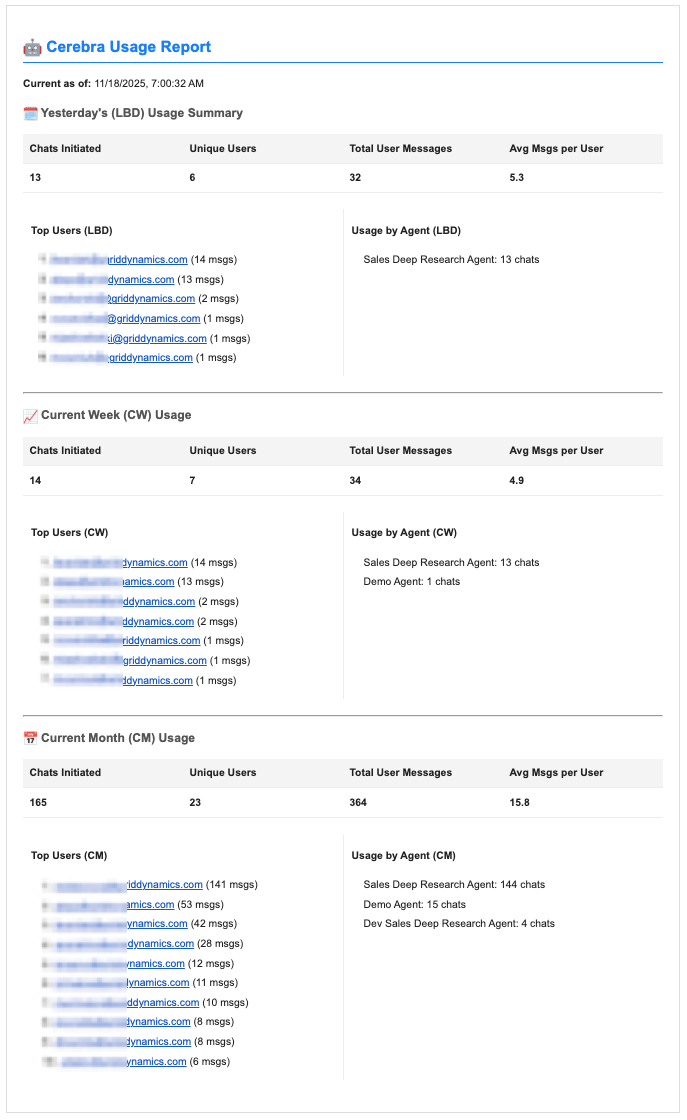
Every morning at 8 AM, N8N runs this pipeline automatically. Four minutes later, the report lands in my inbox.
What I Learned
Ten years ago, this would have required backend developers, database admins, and DevOps engineers. Today? A workflow tool, JavaScript, and an AI assistant. The bottleneck isn't technical anymore—it's permission and access. Organizations that give teams self-service tools will move faster than those that gatekeep everything.
The AI didn't write this for me—it compressed a 2.5-hour project into what might have been 8 hours without it through collaborative problem-solving at the speed of thought. I still made all the decisions about metrics, structure, and when to ship. The first version was basic (no charts, no fancy dashboards), and that was perfect. I shipped it the same evening, got feedback, and can now iterate.
Here's the truth: the best code is code you don't wait for. When you can solve your own problems with self-service tools, you eliminate queue time entirely and learn more by building than by writing tickets.
The Bigger Picture
This wasn't just about getting usage stats for Cerebra. It was a proof point for how work can—and should—happen in 2025:
Problems should be solved by the people closest to them, using accessible tools, with AI assistance, without requiring approvals or tickets for every small automation.
This is the promise of the self-service revolution: anyone can build solutions to their own problems. You don't need to be a software engineer (though it helps). You don't need permissions from five different teams. You need:
- Tools that are accessible (N8N, Zapier, Make.com)
- Data that's queryable (Firestore, SQL databases, APIs)
- AI that can help design solutions (Gemini, ChatGPT, Claude)
- A culture that encourages experimentation
Conclusion: From Idea to Production in One Evening
| When I started (9 PM) | By 11:30 PM |
|---|---|
| A problem (no visibility into Cerebra usage) | A working pipeline |
| Access to data (Firestore) | A clean report in my inbox |
| Access to tools (N8N) | Actionable insights about our platform |
| An AI assistant (Gemini) | A repeatable pattern for future automation |
No tickets. No dependencies. No waiting.
This is how modern development should feel. Fast, autonomous, iterative. The tools are ready. The AI assistants are available. The only question is: are you empowered to use them?
If you're in a position to give your team this kind of access—do it. If you're on a team that has these tools—use them. The gap between "I wish we had data on this" and "here's the automated daily report" has collapsed to an evening.
Go build something.
Want to learn more about self-service automation and AI-assisted development? Read our take on methodology in AI-assisted development, or explore our agentic frameworks overview to see how we're pushing these capabilities even further.